Some quick debugging tips that I came up with whilst building my personal blog.
The 11ty documentation is really great, but when it comes to developing and debugging, I really prefer to use a live debugger.
It can help to understand a problem, but also can serve as a really great way of understanding how you might go about hooking into a framework, in this case 11ty.
Using a filter to debug 11ty
In my config for 11ty projects I put in this little debugging filter.
  eleventyConfig.addFilter("debugger", (...args) => {
    console.log(...args)
    debugger;
  })
You could use this filter to find out the available attributes on a post, for you to use in your template, for example.
I have a hero object on my posts:
---
title: "Tips for debugging in 11ty
hero:
  image: "/images/debugging-11ty.png"
  alt: 'Picture of vscode debugger and 11ty debugging filter'
---
In my code I can check out the variables, and have them logged to the console.
{{ post.data.hero | debugger }}This might seem really silly, but I found this incredibly useful, especially when hooked up with a live debugger (shown later).
On save of a file, I get the object that was passed to the filter, this can be really handy in seeing what variables you have to play with.
Example console.log output:
{
[1] }
[1] Writing dist/tags/design/index.html from ./src/tags.md.
[1] {
[1]   image: '/images/design-day1.png',
[1]   alt: 'Picture of day 1 design of blog'
[1] }
[1] Writing dist/tags/research/index.html from ./src/tags.md.
[1] undefined
[1] Writing dist/tags/webcomponents/index.html from ./src/tags.md.
[1] {
[1]   image: '/images/custom-theme.png',
[1]   alt: 'Picture of using Chrome dev tools to adjust CSS variables',
[1]   show: false
[1] }
[1] Writing dist/tags/accessibility/index.html from ./src/tags.md.
[1] {
[1]   image: '/images/custom-theme.png',
[1]   alt: 'Picture of using Chrome dev tools to adjust CSS variables',
[1]   show: false
[1] }
[1] Writing dist/tags/ux/index.html from ./src/tags.md.
Where this becomes really great is if you use the VSCode debugger to run 11ty, as soon as you use the filter and hit save because of the debugger statement you go right to the debug filter.
Debugging with VS Code
Sure you could console.log, but using the VS Code debugger for this can be extremely helpful to do some of that variable treasure hunting.
To do this, you will need to create a new debug task, you can do this in the UI, but a quick way is to:
- Create a folder in your workspace called
.vscode - Create a file called inside
.vscodefolder calledlaunch.json - Add a debug task for the
eleventyrunner, here is an example:
  {
      "name": "11ty",
      "type": "node",
      "request": "launch",
      "program": "${workspaceRoot}/node_modules/.bin/eleventy",
      "stopOnEntry": false,
      "args": [],
      "cwd": "${workspaceRoot}",
      "console": "internalConsole",
  }
If you want to put it in live watch mode, set args to:
"args": ["--watch"],- Head over to the debugging pane and find the task called
11ty, set your breakpoints up and good to debug.
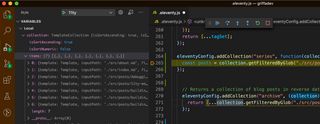
This approach also works really well with writing custom collections, or using data.
  eleventyConfig.addCollection("series", function(collection) {
    // i dont know whats in collection.
    debugger;
  });
Putting this together, the following GIF shows how this can be a nice interactive workflow.
I hope this was helpful to people, 11ty is so lightning fast, that marrying it with the VS Code debugger when you're writing JavaScript is super interactive.